The Sphingidae of Southeast-Asia
(incl. New Guinea, Bismarck & Solomon Islands) Back to start page
by Jan Beck & Ian J. Kitching
Creation of range maps
1.) Compilation of records
From the published literature, unpublished species lists, museums and private collections, we compiled almost 37,500 records for the worldwide distribution of the 382 species of hawkmoths that occur in Southeast-Asia, New Guinea & the Solomon Islands.
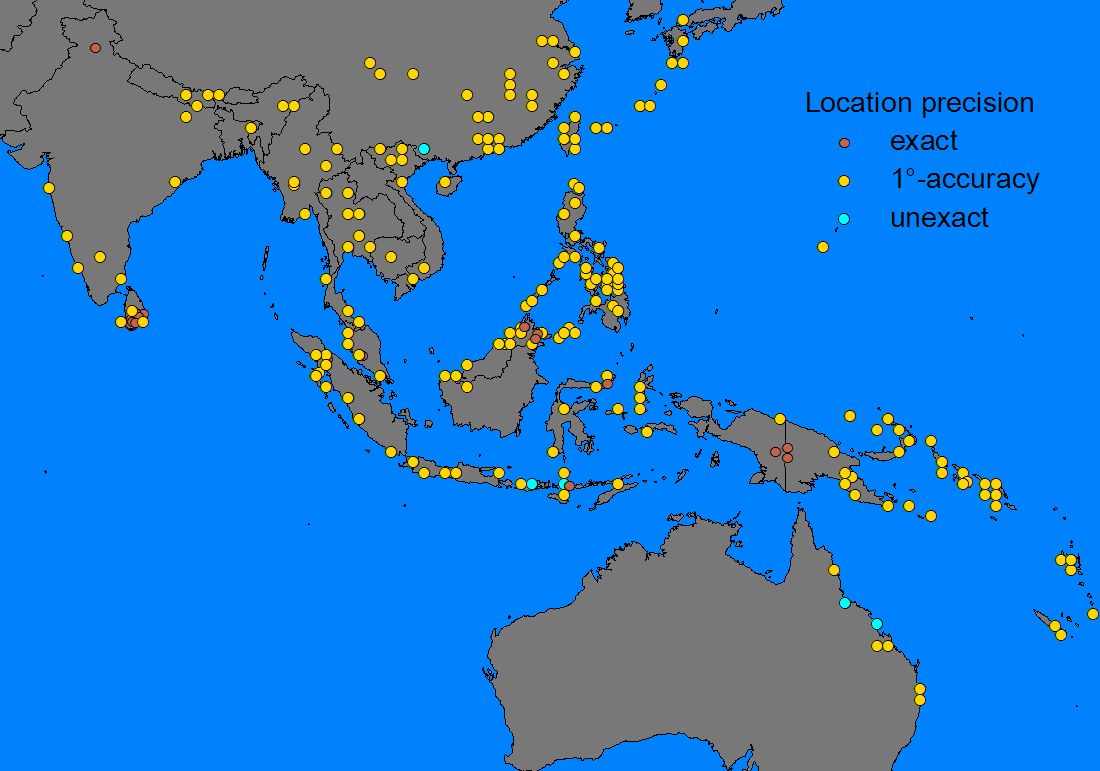
Although ca. 6 % of records included specific information on the latitude and longitude of sampling sites (usually recent records with GPS-data), the geographic position of most records had to be found with the help of the Internet, online gazetteers and various atlases, both modern and old. By this rather tedious procedure we were able assign latitude and longitude to ca. 90 % of records with an accuracy of at least 1°. In many cases it was relatively straightforward to find sites, but a certain degree of detective and sometimes educated guesswork was required to find places that had changed name, spelling (click here for an example), or which are not mapped at all (e.g. expedition camps in New Guinea). Reconstructing collector's travelling routes (considering likely means of transport) often yielded the necessary clues as to where a site was probably situated.
Ca. 4 % of the records were insufficiently detailed to assign them on a 1°-grid (site information such as 'Southeast China' or 'Japan') and were tentatively assigned to the most likely 1°-square, based on collection time, infrastructure and the 'popularity' of regions for collectors.
A small number of records (ca. 0.1 %) raised considerable doubt regarding their credibility for various reasons. Based on the likelihood of misidentifications in some species or the risk of mislabelling or misspelling in large collections, we chose to ignore them for estimating species' ranges, but they are still displayed on the maps (usually with a comment on the reason for exclusion) - future sampling might, of course, prove them to be correct.
Likewise, a number of records were considered credible yet were excluded from the range because we believe them to be stray individuals or vagrants far from their normal breeding range. In many cases this information came from the original data source, in other cases we deduced it based on the other records (e.g. species with tropical distribution and a single-specimen record from South Australia or northern China).
|
Sources of records |
|
Collection of the Natural History Museum (NHM), London |
|
Inoue-Collection (at NHM, London) |
|
Data - I.J. Kitching: own & local collections from Thailand |
|
Collection of the Carnegie-Museum, Pittsburgh |
|
Unpublished species lists (see acknowledgements) Data - J. Beck: own surveys in Malaysia & Indonesia |
|
Collection of the US National Museum of Natural History (Sri Lanka-collection) |
|
Collection of Forest Research Centre of Sabah (FRC), Malaysia |
|
Collection of Zoologische Staatssammlung München |
|
Collection of Museum für Naturkunde, Humboldt Universität, Berlin (MNHU) |
|
Collection of Sabah Parks, Malaysia |
|
Collection H. Barlow, Genting Tea Estate, Malaysia |
|
Collection H. v. Mastrigt, Jayapura, Indonesia |
|
Collection of the Forest Research Institute of Malaysia (FRIM), Kuala Lumpur |
|
Sphingidae of Siberia-websites: Nat. Hist. Mus. of Siberia (Novosibirsk) & private collector |
|
American Museum of Natural History (online databank) |
Table of data sources for distribution records, in declining order of contributed records. One 'record' refers to a species at a certain site in a certain year, it does not imply the number of specimens (which might be much higher).
2. Estimating range areas
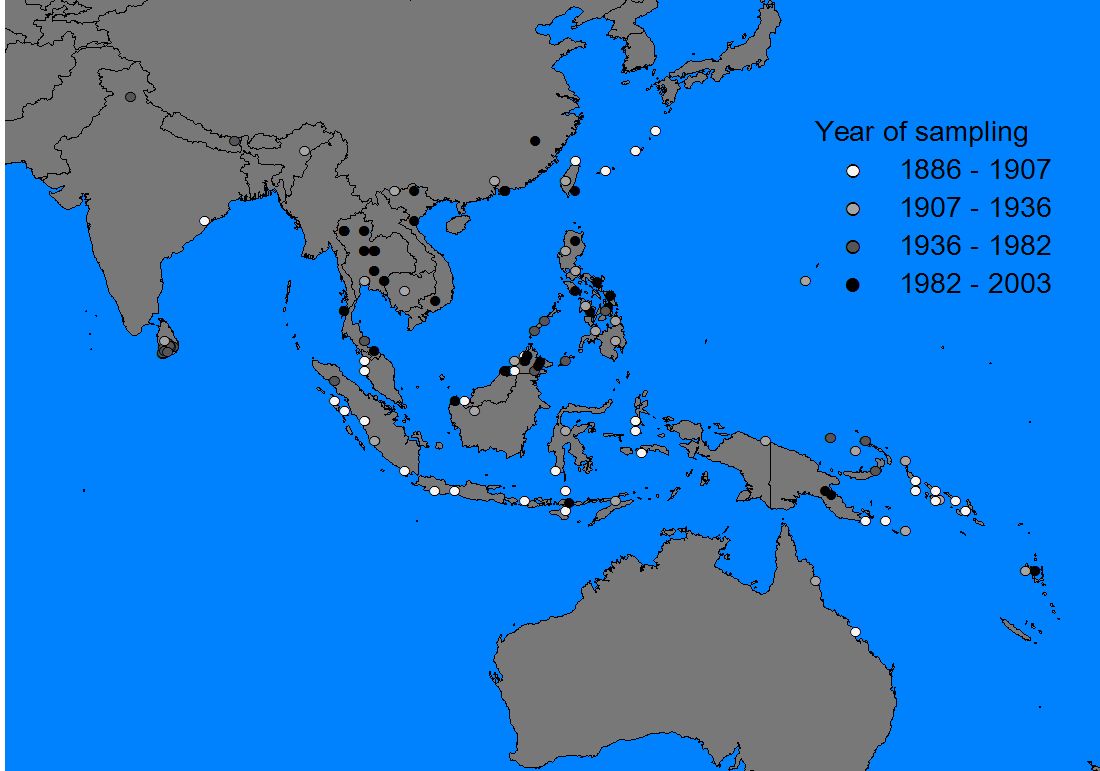
Records were entered into a GIS-program (ArcView 3.2), in which it was possible to display them by species, subspecies, record accuracy, altitude and year of sampling (if known). As a base map the world map of ArcView 3.2 seemed sufficiently detailed, although some small islands in the Philippine/Moluccan region and the South Pacific were missing (these were hand-digitized from various naval maps and inserted into the world map where necessary).
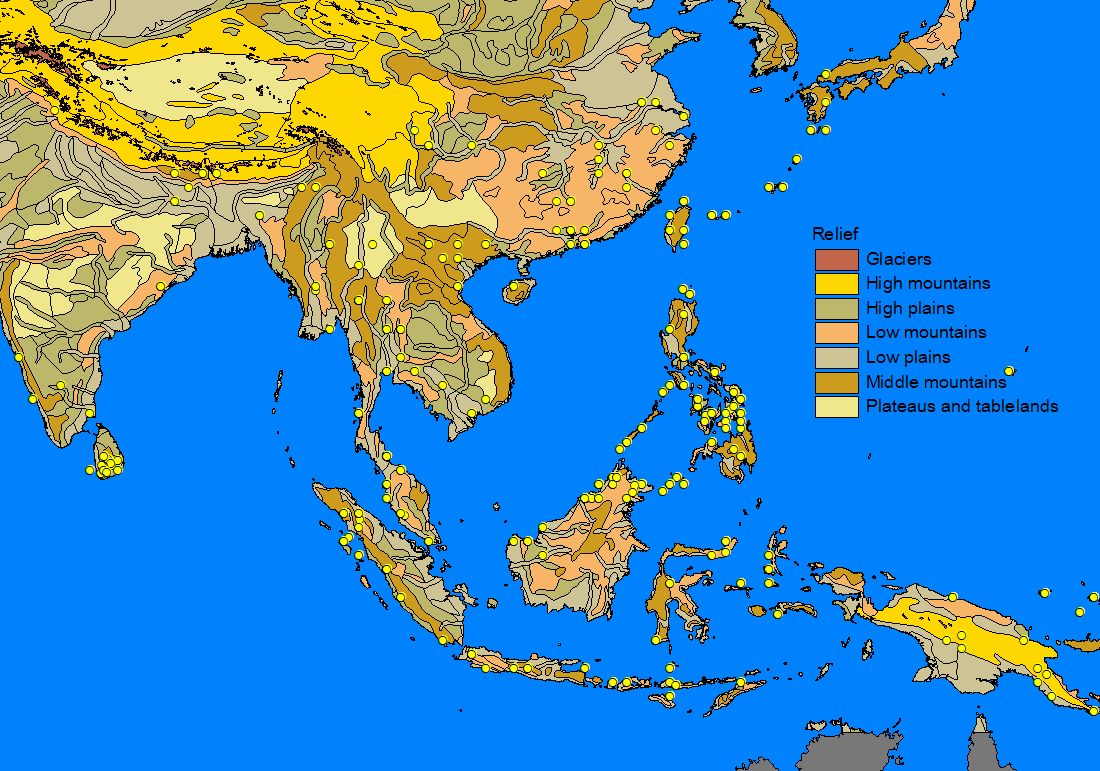
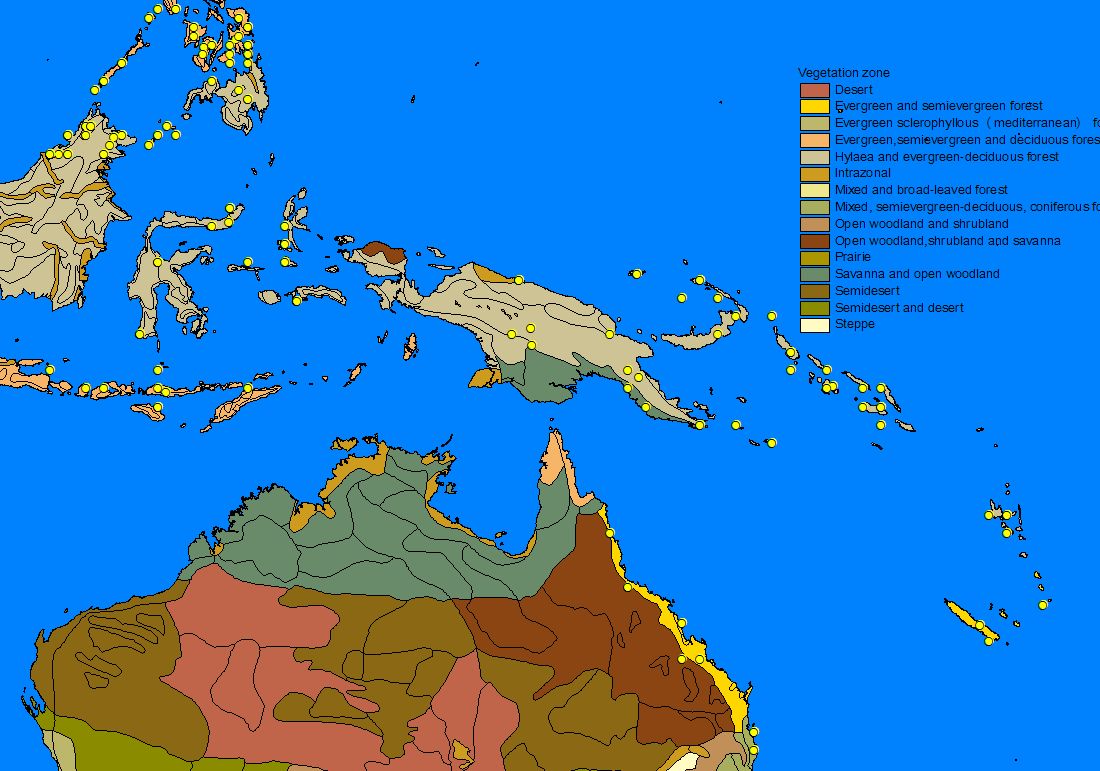
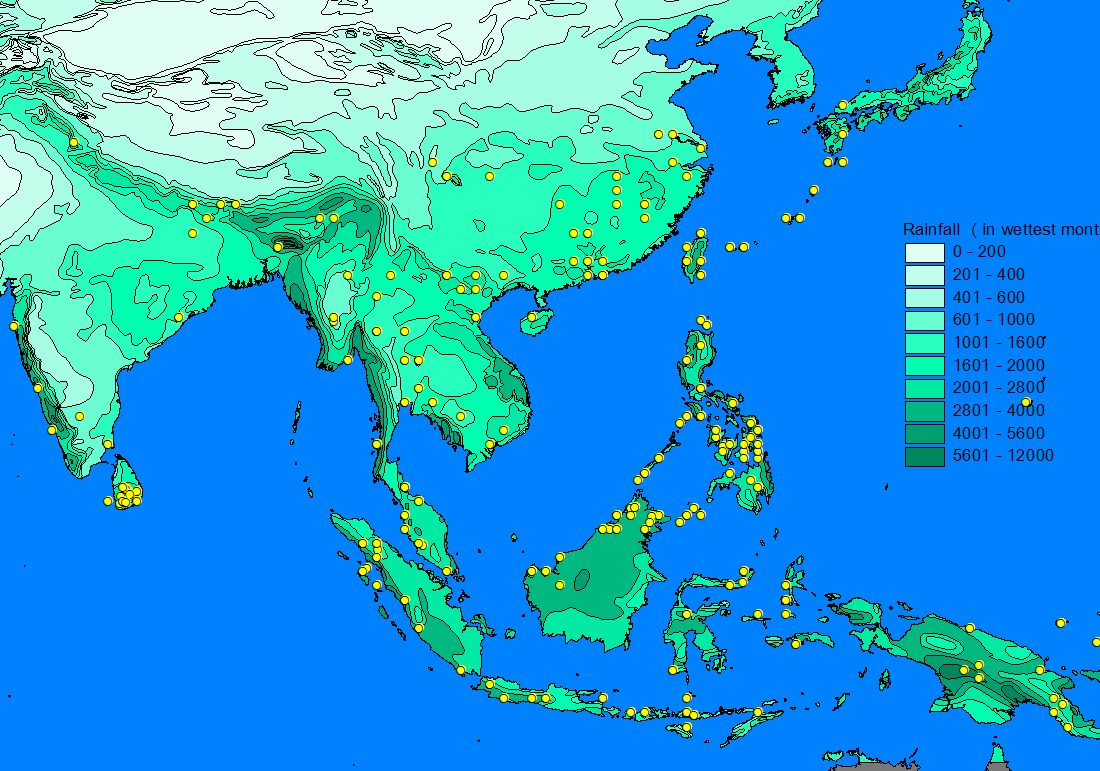
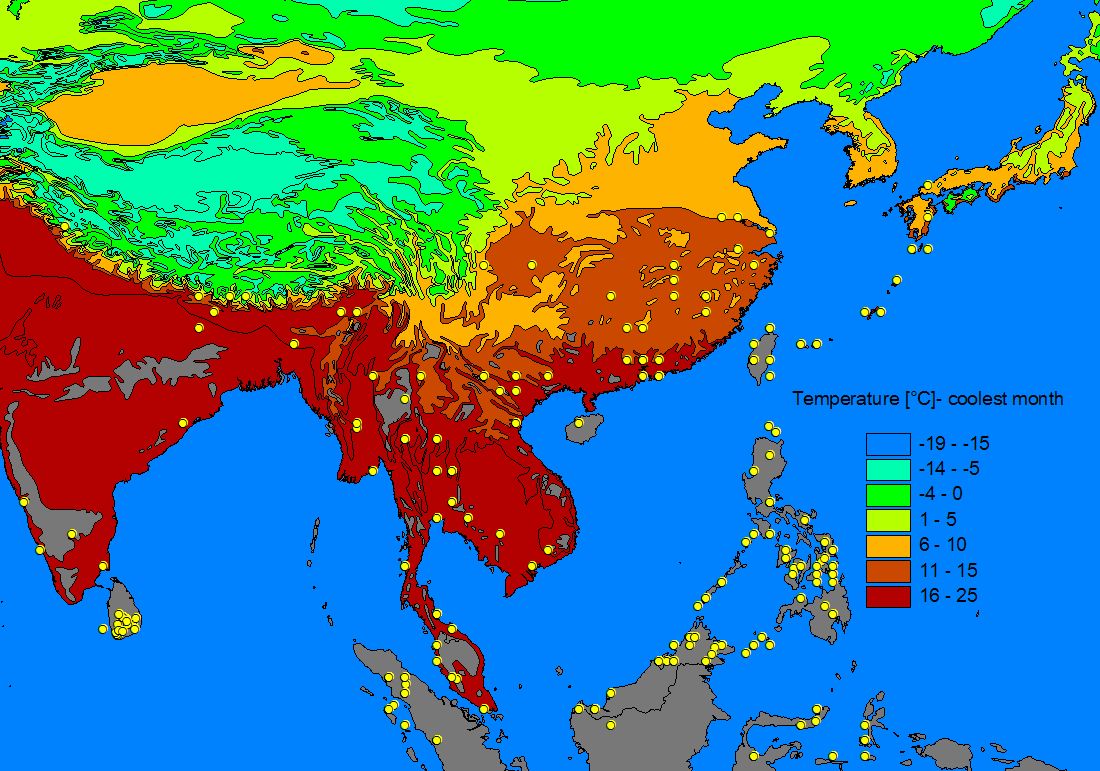
A number of GIS-compatible habitat maps were downloaded from the Internet and used to 'underlay' the species records in order to determine patterns of distribution. Altitudinal relief, vegetation zones, precipitation and minimum winter temperature often matched the outer limit of records and a number of apparently important parameters for sphingid distributions could be identified (see also Quinn et al. 1997, 1998): Minimum temperatures often appeared to determine the northern limit of a species, whereas temperate species are often found only in montane areas on the southern, tropical boundary of there range. Rainfall is a very important parameter for tropical Southeast-Asian species, which thus often show distribution patterns with a 'finger' along the wet Himalaya foothills and a disjunct areal in the wet Western Ghats, while the dry central part of India is uninhabited. Likewise, many Southeast-Asian species are found in the northern (particularly north-eastern), wet parts of Australia but not in the dry interior.
However, the limits of many species within the Malay Archipelago, seem to be determined more by recent or historical geography than by habitat alone, so that a species’ range did not extend beyond that implied by actual records in that region. Generally, if in doubt, we preferred a conservative approach that would underestimate rather than overestimate species' ranges.
Uneven sampling effort in different regions can disturb this straightforward procedure. Whereas an unrecorded species in well-sampled northern Thailand or northeast Borneo probably indicates its absence from that region, it is most unlikely to do so in undersampled Laos, Burma or southern (Indonesian) Borneo. Furthermore, certain species (e.g. day-active Macroglossum or Cephonodes) are more likely to be overlooked (or misidentified) than others.
Taking all these factors into consideration, we digitized the best possible estimate of each species range, which nevertheless may yet have to be extended by further records of which we are not aware. Some very common and widespread species [e.g. A. convolvuli] regularly migrate during favourable seasons into regions where they cannot permanently persist (e.g. tropical species into Europe, northern China, temperate Australia). In these cases we separated the estimated range into permanent ('breeding') and migrant ranges - extrapolated from very well surveyed regions such as Europe, South Korea or Japan.
The GIS-approach not only makes it easier and more precise to estimate distribution patterns by overlapping records with maps of potentially important habitat parameters, but it also allows the resulting range maps to be used for further analysis. Area sizes and other measures of distribution can easily be calculated from the range estimates and (recorded and estimated) species checklists for regions (countries, islands, grid-squares) can be extracted from overlaid map themes.
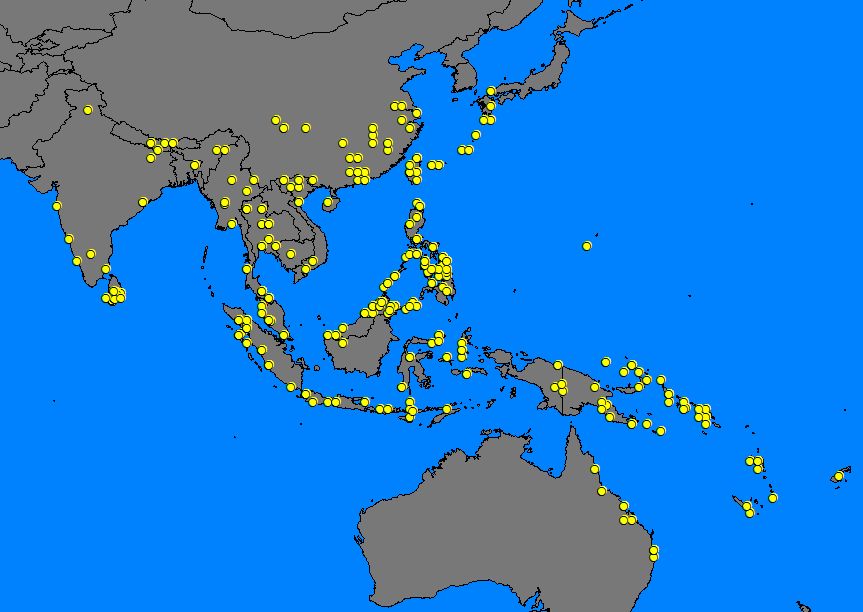
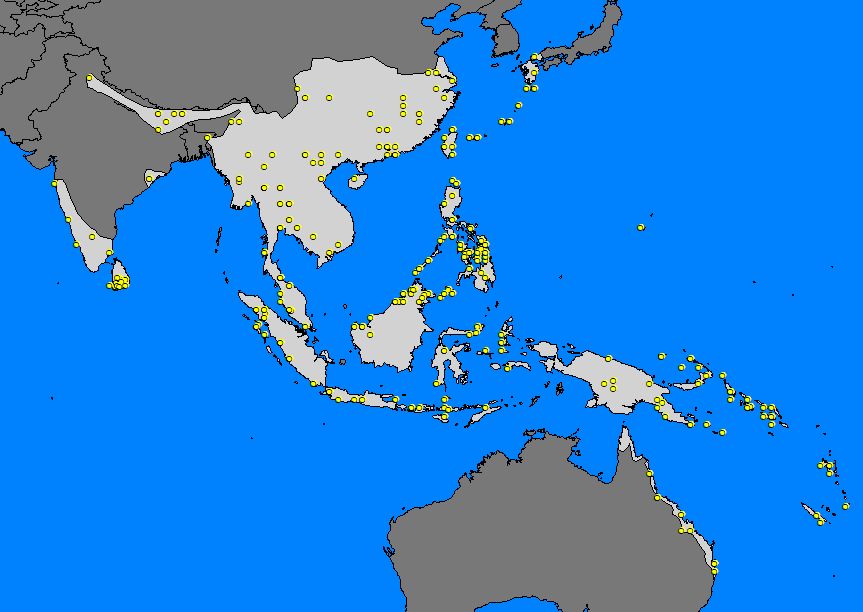
The following maps give an example of the procedure of creating a range estimate (using the range records of Theretra silhetensis):
1) Mapping of records
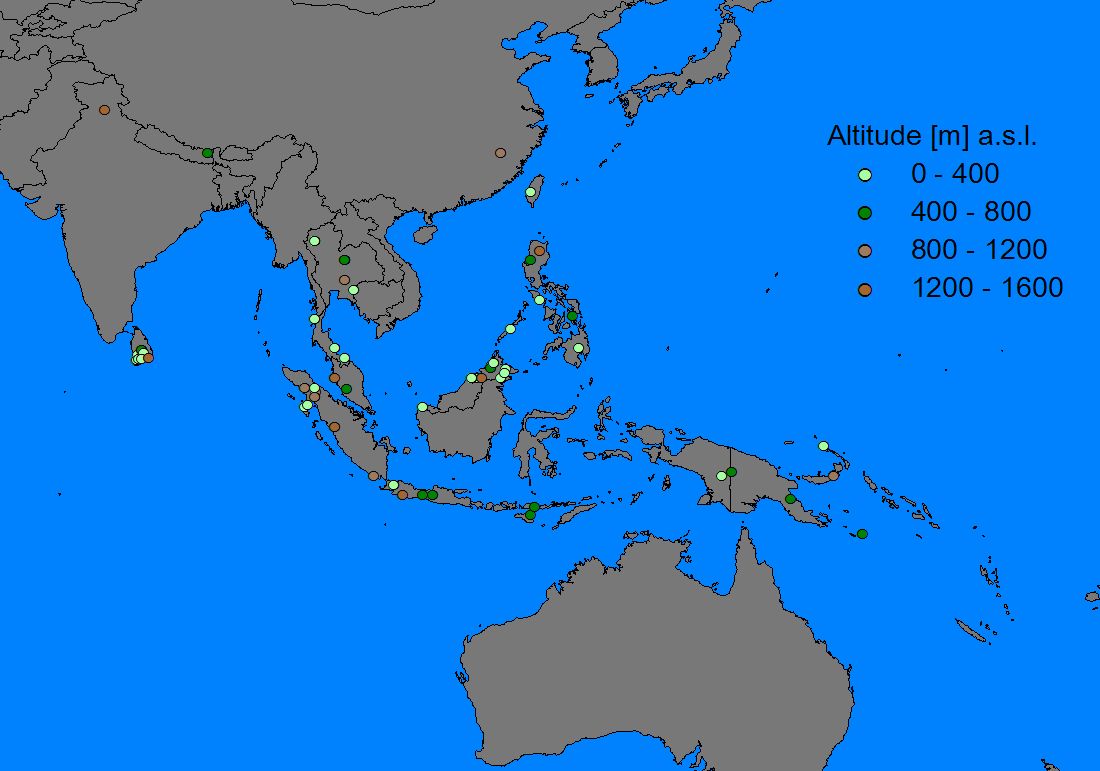
2) Habitat parameter maps
3) Mapping of species range
4) Measurements of range size
Area size of range estimate: 8.493.752 km2
Min. convex polygon around records (land area only): 13.304.340 km2
Northernmost record: 34,5°
Southernmost record: -28,5°
Latitudinal extent of records: 63°
Westernmost record: 72,8°
Easternmost record: -170,5°
Longitudinal extent of records: 116,7°
While many species follow one of a few 'typical' distribution patterns (see Patterns of diversity and distribution), quite a variety of distribution and range sizes were found. Most species are fully contained within 'Southeast-Asia', or at least have their centre of distribution there, whereas others barely enter the region. The smallest estimated ranges were those of Ambulyx suluensis and Macroglossum castaneum, which occur on only one or few small islands (less than 3000 km2). At the other extreme, species such as Agrius convolvuli or Hippotion celerio can be found almost everywhere in the Old World tropics (with breeding range sizes well over 25 million km2).
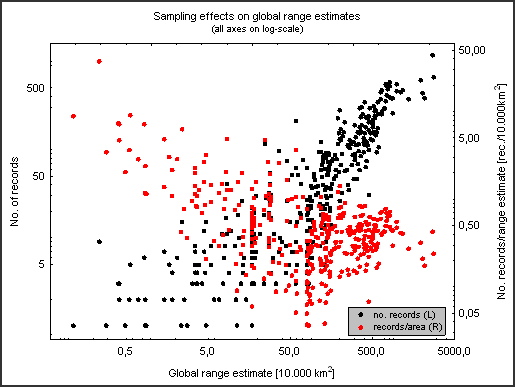
Species might be sampled and reported unequally for various reasons – some may be hard to catch (e.g. those not attracted to light), uninteresting to commercial collectors and/or taxonomists (“common” species!), have late-night flight times or restricted flight periods during the year, be local rarities with small populaton sizes, etc. These can all influence the quality of the range estimates. The number of records will always rise with the range estimate (as the latter is dependent on records), but the number of records per estimated range area (as a measure of estimate quality) should ideally stay constant. As the graph below shows (on a log-scale), this is not the case – small ranges are better ‘covered’ by records than large ranges.